Measurement matters
Web analytics is bigger than ever.
As this is a blog post all about data, I should probably start by backing that statement up with some statistics. The UK market for web analytics grew by 12% during 2011 to £104 million, fuelled in part by the economic downturn increasing demand from management for measurable results. Worldwide, 82% of companies use analytics to measure the effectiveness of website changes, and 72% judge the success of their digital campaigns through analytics.
People power
In addition to the growing availability of sophisticated free analytics tools (notably Google Analytics, used by 87% of UK companies, and exclusively by 38%), it mustn’t be forgotten that companies also need people behind the software. Even the best-designed tools need data analysts who can translate raw data into understandable insights, give them context and use them to drive action.
With the wealth of data available, co-ordinating and managing these tasks is undoubtedly challenging (a feeling reinforced by the rising popularity of third-party analytics consultancies), and definitely too complex to explain in a single blog post; however, I do want to go through some metrics you should definitely make time to look at, and explore how you can use your findings to make real improvements.
Four key metrics
It’s important to reiterate that this is by no means an exhaustive list – if you’ve ever looked at an analytics tool you’ll see that there are limitless combinations and permutations of numbers for data whizzes to get excited about! The following metrics do, however, provide a good starting point for building a comprehensive view of site activity, and are all accessible from Google Analytics.
1. Content
It’s a truth (nearly) universally acknowledged that “Content is King”, so it makes sense to have it as a central component of your analytics. Look at your most popular pages and check you’re really getting the most from all this attention by optimising your content. In particular focus on ensuring your calls to action (CTAs) get people moving through to business critical areas of your site (for more advanced GA users, the Visitor Flow function can really help with identifying current user journeys and drop-off points.
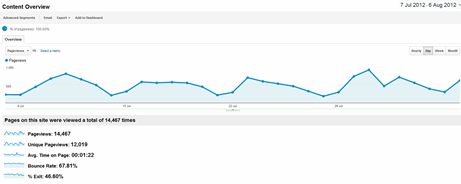
Turning your attention to the other end of the scale can also be useful; by finding out which pages people aren’t visiting you can concentrate efforts and increase investment in driving traffic to these areas. Perhaps an AdWords campaign, email newsletter drive or increased internal linking could attract valuable visitors?
2. Traffic sources
This metric covers a lot of information, so the potential for insight is huge. As you land on the Traffic Sources tab in GA you’ll be presented with an immediate overview of the methods people are using to get to your page – Search, Direct, Referral, Campaigns etc. Even without going further this can be useful for understanding the effectiveness of your current online marketing mix.
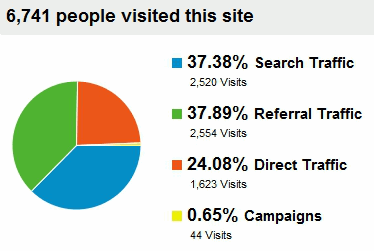
If you want to make a real impact though, drill down into the specific sources that are sending users to your site. From here you can see which search engines are producing the best results and adapt your SEO and PPC strategies as necessary. The Traffic Sources tab is also a good way to assess the performance of off-site activities such as press releases, guest blogging, social media and more (for even greater depth you can combine the pure traffic numbers with bounce rate, pages/visit, time on site and other key user behaviour statistics).
3. Search terms
Analysing organic search keywords is often really valuable, as they can provide a direct view into how your users think. With a knowledge of the language users are actually employing to search for your company, products or service you can review your copy and site structures to mirror this, or change your language altogether if the audience you’re currently attracting is not of great value. You may even consider involving SEO and User Experience teams for a solution that balances the requirements of search engines with the needs and expectations of your users.
If you’ve got internal search set up on your site, head over to the Content tab of GA and look at the search terms being used there too. If people are searching for something, it’s likely that they’ve already tried and failed to find it on your site. Can you make it easier for users to access the content they need? If you find consistently popular search queries you may even want to create or adapt content to meet this demand.
![]()
4. Devices
The question of devices has started to infiltrate every aspect of digital, and analytics is no different. It’s definitely worth finding out how many of your users operate on mobile or tablet devices, as this could have implications for your site’s structure, content and design if you have to cater for smaller screen sizes. Additionally, if you do have a lot of mobile users, taking advantage of the personalisation capabilities available (based on location, activity and more) can help increase conversions.
The question of devices is also pertinent when deciding on the wider mobile strategy of your business. If you don’t have many mobile users, simply providing a ‘lite’ version of your existing site or checking for obvious accessibility issues may be sufficient, but if your site’s being accessed via a range of devices you may instead want to go for dedicated applications or a responsive framework. When making the case for resources and budget, having statistical information to hand is invaluable.
Where next?
Looking at these metrics should give you a great foundational understanding of what’s happening across your website. What’s more, this kind of information is easily accessible for non-technical people, making it easier to present your findings to senior stakeholder and get sign-off on initial actions to refine and improve your online activities.
However (and I know I keep saying this, but it is important!), this blog post is an introduction to the basics of analytics. There is an absolute wealth of data out there and virtually unlimited ways in which it can be used to tell stories; about your users, your industry, the digital environment and more. This issue is only set to increase as companies strive for the ‘holy grail’ of analytics; data integration. Customising tools and refining processes to connect information across a range of sources including email, social and even offline can take months. However, the power that such a holistic view can give you can’t be understated.
There are plenty of resources available online to help you get to grips with the more complex aspects of GA, including Google Analytics’ IQ lessons and Econsultancy’s 10 great GA walkthroughs, or you can get in touch with a member of our team to find out more about how Box UK can help you kick-start your analytic efforts.